
ClickHouse HA on a Mac, part 4: MEMORY_LIMIT_EXCEEDED on a query that needs 8 MiB
Published By Krzysztof Książek Lab
Lab write-up. A hands-on environment built and run by the author, not a customer engagement.
Environment described in the article: ClickHouse 25.8, ClickHouse Keeper 25.8, HAProxy 3.2, Docker Desktop 29.7.2 / Compose 5.4.0, macOS 27.0.1 (Apple silicon).
Series: 1 build · 2 when nodes die · 3 insert_quorum, no loss, production · 4 MEMORY_LIMIT_EXCEEDED at 8 MiB
The first time I ran this lab on my Mac, the experiments never really started. Within a couple of minutes the reader’s GROUP BY was failing with MEMORY_LIMIT_EXCEEDED, more often than it succeeded. It’s a query that, when ClickHouse lets it run, peaks at about 8 MiB. So what was eating the memory?
This post stands on its own. You don’t need parts 1 to 3 for it, only to know that a small load generator writes 1,000-row inserts and runs a GROUP BY in a loop.
What it looked like
The first version of the lab capped each ClickHouse server at 1.5 GB (max_server_memory_usage) and kept the default lifetime for old parts. I ran the lab’s tools/memdiag.sh, which deploys the cluster with its load generator and then samples each server every five seconds. This is ch-2 on 29 October from 22:55:38 (WET), with the columns trimmed to tracked memory, resident memory, then the allocator’s own figure, all in MiB:
time     host tracked_MiB rss_MiB jemalloc_alloc_MiB ...
22:55:38 ch-2 508 1066 681
22:55:43 ch-2 510 1327 896
22:55:49 ch-2 528 1445 1098
22:55:54 ch-2 542 1535 1272
22:55:59 ch-2 526 1566 1301
22:56:04 ch-2 Received exception from server (version 25.8.33):
...
22:57:00 ch-2 564 1803 1884
Resident memory went past 1,430 MiB, which is the 1.5 GB cap, eleven seconds after the first sample. After that my own sampling query started failing too. By the end of the test the load generator looked like this:
22:57:40 [ 127s ] inserts/s: 29 ins_err/s: 0 selects/s: 0 sel_err/s: 5Inserts were fine. Every select failed.
The reader’s error log had 407 MEMORY_LIMIT_EXCEEDED lines.
Read the error message, not the query
My first guess was the obvious one: the GROUP BY uses too much memory. It doesn’t. The error spells out what ClickHouse actually checked:
Code: 241. DB::Exception: Received from localhost:9000. DB::Exception: (total) memory limit exceeded:
would use 538.95 MiB (attempt to allocate chunk of 0.00 B bytes), current RSS: 1.40 GiB, maximum: 1.40 GiB.
Look at the two numbers. The memory ClickHouse tracks for queries and merges was about 540 MiB. The resident memory of the whole process, current RSS, was 1.40 GiB, right at the maximum. As far as I can tell from that message, 25.8 refuses new allocations once the process RSS reaches max_server_memory_usage, not only when its tracked memory does. So whatever asked for memory next got the error, however little it wanted. On this load that was nearly always the reader, simply because it allocates more often than anything else.
That’s why a query that needs a few megabytes can fail with a memory error.
It isn’t asking for too much. It’s asking at the wrong moment.
Where the memory went
The table above already holds the uncomfortable part. Tracked memory sat between 508 and 564 MiB on ch-2, while the allocator’s figure (jemalloc.allocated) climbed from 681 to 1,884 MiB in about a minute and a half. Most of the growth was memory the server doesn’t attribute to anything.
I tried two things in the lab’s cluster.xml. Old parts are dropped after 10 seconds instead of the default 480, because every 1,000-row insert creates a part and merges leave the replaced ones behind for that long. And the cap went up to 4 GB:
<merge_tree>
    <!-- drop merged-away parts after 10 s instead of 480 s -->
    <old_parts_lifetime>10</old_parts_lifetime>
    <cleanup_delay_period>1</cleanup_delay_period>
    <max_cleanup_delay_period>2</max_cleanup_delay_period>
</merge_tree>
<max_server_memory_usage>4000000000</max_server_memory_usage>
I’ll be honest about the part cleanup here. I don’t have a clean before-and-after count of old parts on the Mac with the original settings, so I can’t tell you how much of the growth it removed. With the new settings the full runs peaked at 713 to 831 outdated parts per server. What I can show is what happened to memory.
With 4 GB and a 10-second part lifetime
The same five-minute test with the new cluster.xml, from 23:23 on 29 October, ch-2 again:
time     host tracked_MiB rss_MiB jemalloc_alloc_MiB ... threads
23:23:07 ch-2 99 1111 704 ... 677
23:23:32 ch-2 121 1750 1270 ... 804
23:24:03 ch-2 124 1944 1468 ... 804
23:25:05 ch-2 102 2287 1708 ... 804
23:27:08 ch-2 85 2375 1800 ... 804
23:28:04 ch-2 89 2416 1791 ... 805
...
ch-2 reader query memory (MiB) p50/max, count, errors: 3 8 5482 0
MEMORY_LIMIT_EXCEEDED in reader.err: 0
Resident memory still climbed to 2,416 MiB before it flattened. The allocator’s figure flattened at about 1,800 MiB. Tracked memory stayed under 130 MiB. And the reader ran 5,482 queries on ch-2 without a single error, at a median of 3 MiB and a maximum of 8.
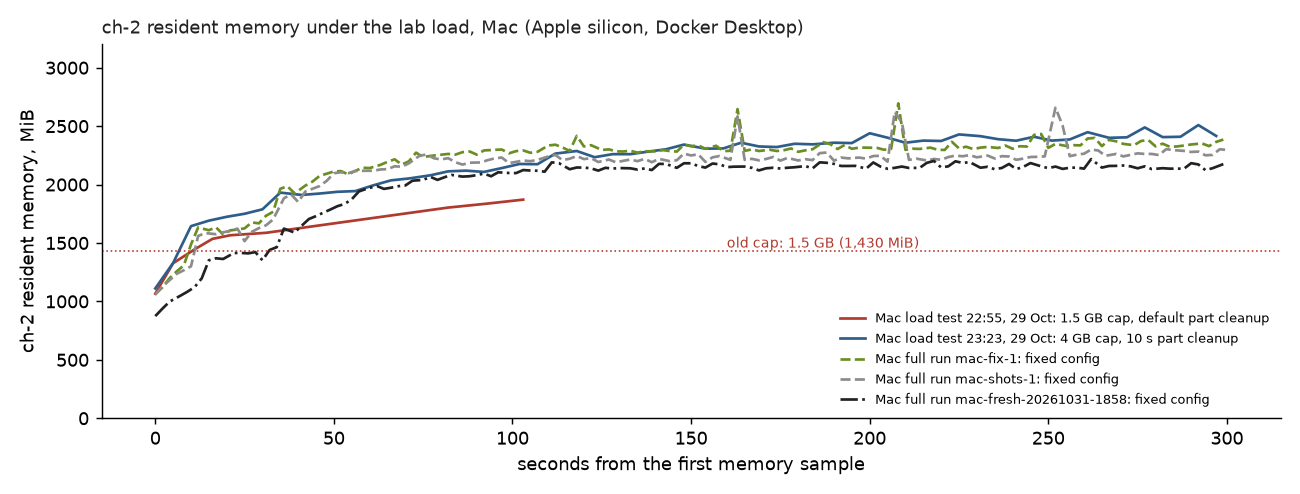
So did the fix fix it, or did it just move the ceiling? Mostly the latter. The server ran about 800 threads on a 12-CPU VM, and something in there holds on to 1,700 MiB that MemoryTracking never sees. I didn’t pin down what. The 4 GB cap simply leaves enough headroom above where it levels off.
The three full experiment runs agree. Resident memory peaked at 2,142 to 2,813 MiB per server, the reader’s GROUP BY peaked at 6.4 to 8 MiB, and neither the reader nor the writer logged a MEMORY_LIMIT_EXCEEDED in any of them. Docker’s own view of ch-2 in the latest run peaked at 2,340 MiB.
Verdict
If you get code 241 and the message says current RSS is at the maximum, stop looking at the query. Compare MemoryResident with MemoryTracking instead. When the first is far above the second, the cap is too close to what the process needs just to exist, and no query tuning will help. For this lab on an Apple-silicon Mac I’d give each server at least 4 GB of cap and Docker 8 GB or more, since the two servers’ peaks in one run add up to about 5,500 MiB.
If you skipped the rest, part 3 goes through what I’d change before any of this lab’s settings went near production.