
ClickHouse HA on a Mac, part 1: two replicas, three Keepers and HAProxy
Published By Krzysztof Książek Lab
Lab write-up. A hands-on environment built and run by the author, not a customer engagement.
Environment described in the article: ClickHouse 25.8, ClickHouse Keeper 25.8, HAProxy 3.2, Docker Desktop 29.7.2 / Compose 5.4.0, macOS 27.0.1 (Apple silicon).
Series: 1 build · 2 when nodes die · 3 insert_quorum, no loss, production · 4 MEMORY_LIMIT_EXCEEDED at 8 MiB
I keep getting the same question about replicated ClickHouse: what does the application actually see when a replica or a Keeper node dies? Docs tell you what should happen, but I wanted to watch it, second by second, on a cluster small enough to run on my Mac.
So I built one, and then I broke it in four different ways. This first part is only the build. The breaking starts in part 2.
What’s on the laptop
Two ClickHouse servers hold the same table, three ClickHouse Keeper nodes coordinate them, and HAProxy sits in front as the only address the application knows. There’s no primary and no failover tool, so either replica takes inserts.
your app (loadgen)
        |
        v
    HAProxy           the only address the app knows
        |
        +-- ch-1      replica, takes inserts and selects
        +-- ch-2      replica, takes inserts and selects

keeper-1, keeper-2, keeper-3
        a Raft ensemble that both replicas use
        to agree on which data parts exist
I ran everything on a MacBook with an Apple M4 Pro (12 cores, 24 GB of RAM), on macOS 27.0.1. Docker Desktop 29.7.2 with Compose 5.4.0 gave its VM 12 CPUs and 15.6 GiB. The images were clickhouse/clickhouse-server:25.8 (25.8.33.6), clickhouse/clickhouse-keeper:25.8 and haproxy:3.2, all arm64.
Let me be clear about what this isn’t: it’s not a production setup. Six containers share one laptop, the passwords are plain text, and there’s no TLS. Part 3 goes through what I’d change before any of it went near a real server. The scripts and configs are in the lab folder 20261029-clickhouse-replicated-ha, so I won’t paste every file here.
One command to build it
From a clone of the repository:
cd database-labs/20261029-clickhouse-replicated-ha
./scripts/lab.sh deploy
./scripts/lab.sh verify
deploy pulls the images, removes any earlier copy of the lab, starts the six containers, creates the table, loads a million seed rows, waits for HAProxy to mark both servers UP and starts the load generator. This is the output from my run on 31 October, trimmed:
== pull images ==
 Image haproxy:3.2 Pulling
 ...
== remove any previous lab ==
== start three Keepers, two ClickHouse servers, HAProxy ==
 ...
 Container haproxy Started
ch-1 and ch-2 answer queries
== wait for a Keeper leader ==
== database and replicated table ==
ch-2	9000	0		1	0
ch-1	9000	0		0	0
...
== a million rows with known dimensions ==
== wait for HAProxy to mark both servers UP ==
== start the load generator ==
18:59:14 [ 1s ] inserts/s: 23 ins_err/s: 0 selects/s: 21 sel_err/s: 0
18:59:15 [ 2s ] inserts/s: 33 ins_err/s: 0 selects/s: 35 sel_err/s: 0
18:59:16 [ 3s ] inserts/s: 32 ins_err/s: 0 selects/s: 34 sel_err/s: 0
deploy: done. Run ./scripts/lab.sh verify
How long does that take? On this Mac it took 15.4 seconds, from 18:59:02.809 to 18:59:18.179 (WET), with the images already pulled. Two earlier runs on the same machine took 14.8 and 15.6 seconds. The first pull is slower, of course, because it depends on your connection.
The two ch-1/ch-2 lines in the middle come from CREATE ... ON CLUSTER lab. Each server reports that it ran the DDL, which is a quick way to see that both replicas and Keeper are talking.
The three settings that matter later
Most of the config is boilerplate. Three parts of it explain almost everything you’ll see in the later posts, so I’ll show them now.
Each replica holds a session with Keeper. In cluster.xml:
<zookeeper>
    <node><host>keeper-1</host><port>9181</port></node>
    <node><host>keeper-2</host><port>9181</port></node>
    <node><host>keeper-3</host><port>9181</port></node>
    <session_timeout_ms>30000</session_timeout_ms>
    <operation_timeout_ms>10000</operation_timeout_ms>
</zookeeper>
That 30-second session timeout comes back in part 2, where a dead server still looks active. HAProxy health-checks each server with /replicas_status on its HTTP port:
backend ch_native
    mode tcp
    balance roundrobin
    option httpchk GET /replicas_status
    default-server check port 8123 inter 1s fall 2 rise 2 on-marked-down shutdown-sessions
    server ch-1 ch-1:9000
    server ch-2 ch-2:9000
It checks once a second, marks a server DOWN after two failures and UP after two successes. The third thing is the table:
CREATE TABLE IF NOT EXISTS lab.events ON CLUSTER lab
(
    ts      DateTime64(3),
    batch   UInt32,
    id      UInt64,
    user_id UInt32,
    value   Float64
)
ENGINE = ReplicatedMergeTree('/clickhouse/tables/{shard}/lab/events', '{replica}')
PARTITION BY toYYYYMMDD(ts)
ORDER BY (user_id, ts);
The batch column is how I prove, in part 3, that nothing acknowledged went missing. The same cluster.xml also carries two memory settings: a 4 GB cap plus a 10-second lifetime for old parts. They’re there because of what happened on my first attempt, and that’s part 4.
How to read a load line
The load generator pretends to be the application. It’s a short bash script running one writer and one reader in parallel, both through HAProxy as the user app. The writer inserts 1,000 rows per statement, one statement after another, and records each acknowledged batch number. The reader runs a GROUP BY over the whole table in a loop. Every statement is a new clickhouse-client process with its own connection, so a dead server shows up as an error, not as a stuck pool.
Once a second it prints a line like this one:
18:59:21 [ 8s ] inserts/s: 31 ins_err/s: 0 selects/s: 32 sel_err/s: 0Scroll horizontally to see all columns when needed.
| Field | Meaning |
|---|---|
18:59:21 | Clock time of the second being counted, so you can line it up with a kill. |
[ 8s ] | How long the load generator has been running. |
inserts/s | Inserts that succeeded in that second. Each one is 1,000 rows. |
ins_err/s | Inserts that returned an error in that second. |
selects/s | Selects that succeeded in that second. |
sel_err/s | Selects that returned an error in that second. |
One thing to keep in mind is that the writer runs one statement at a time, so inserts/s: 0 ins_err/s: 0 doesn’t mean it’s idle. It means one insert has been sent and hasn’t come back yet. Repeat that line for two minutes and you’re looking at a hung insert. You’ll see exactly that in part 2.
In the 15 seconds before the first experiment, my run did 18 to 34 inserts and 22 to 36 selects per second, with no errors. The two earlier runs on the same Mac were a bit faster, 27 to 44 inserts per second. The laptop was doing other work during the latest run, so I’d compare every failure with the lines just before it, not with these absolute numbers.
Is it healthy?
verify checks the starting state: one Keeper leader and two followers, both replicas writable and seeing each other, the million seed rows on both, and both servers UP in HAProxy. It’s safe to run while the loader is writing. Here’s what it printed 20 seconds after the deploy:
verify: steady state ok (keeper 1 leader + 2 followers, 2 writable replicas, 1000000 seed rows each, haproxy 2/2 UP)It passed in all three of my Mac runs.
Behind that one line, this is what the cluster looked like:
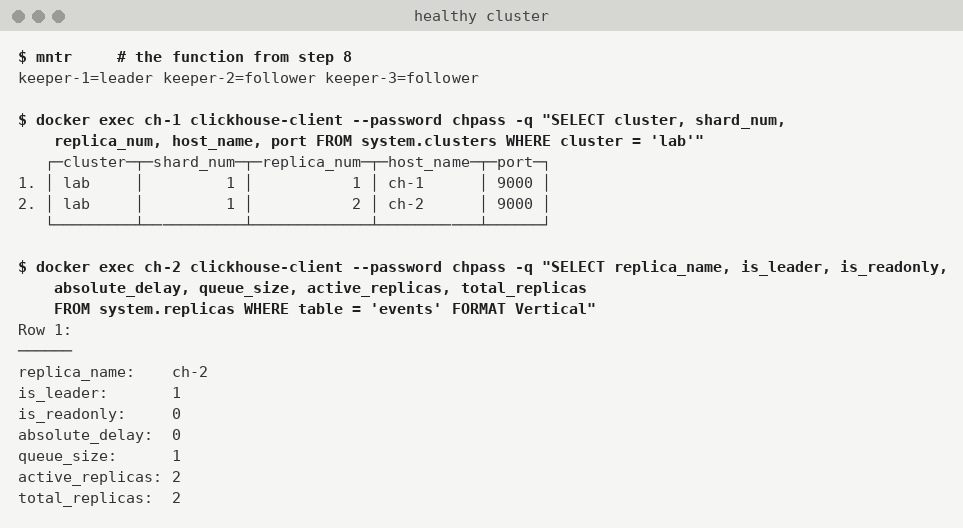
Notice queue_size: 1 on ch-2. The loader was already writing, so there’s usually a part or two in flight. That’s why verify allows a short queue but insists on a delay under 10 seconds.
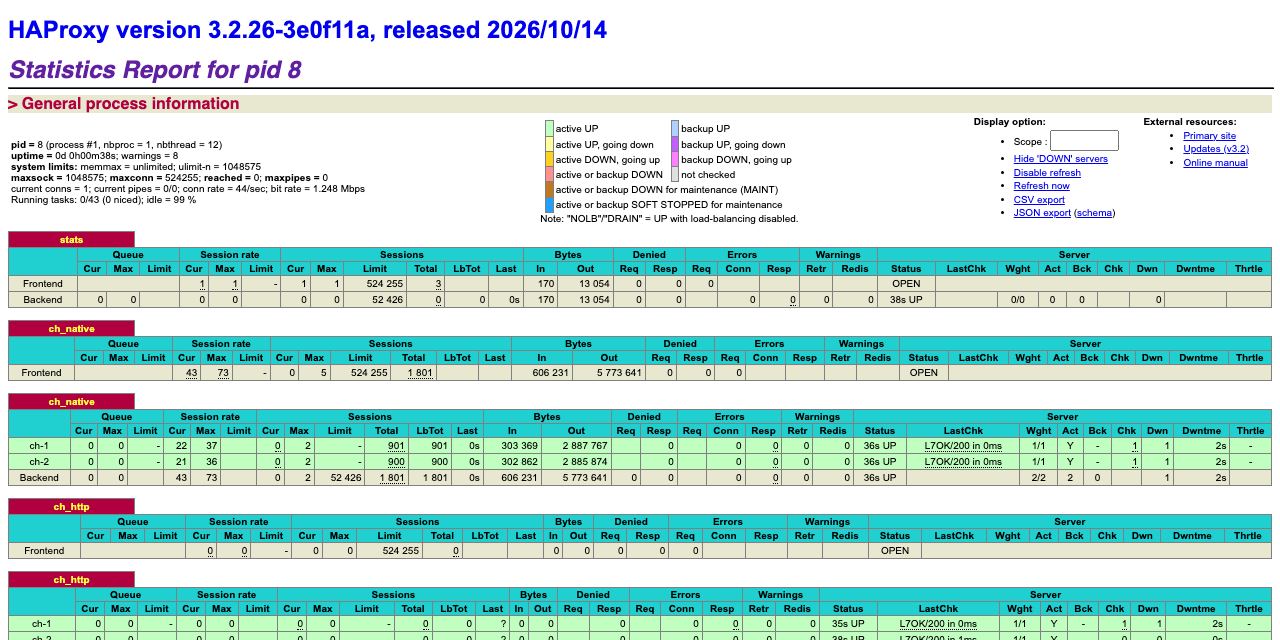
The HAProxy stats page, on http://127.0.0.1:18404/, tells the same story in green:
Verdict
Fifteen seconds and one command gets you a two-replica cluster with a real coordinator and a proxy, on a laptop. That’s cheap enough that I’d rebuild it from scratch before every experiment rather than trust state left over from the last one. Run verify first, every time. If it doesn’t say steady state ok, nothing you measure afterwards means much.
Next, in part 2, I kill ch-1 under load and watch what the application gets back, then go after Keeper.