
ClickHouse HA on a Mac, part 2: when nodes die
Published By Krzysztof Książek Lab
Lab write-up. A hands-on environment built and run by the author, not a customer engagement.
Environment described in the article: ClickHouse 25.8, ClickHouse Keeper 25.8, HAProxy 3.2, Docker Desktop 29.7.2 / Compose 5.4.0, macOS 27.0.1 (Apple silicon).
Series: 1 build · 2 when nodes die · 3 insert_quorum, no loss, production · 4 MEMORY_LIMIT_EXCEEDED at 8 MiB
The failure everybody plans for is a dead server. With MySQL that usually means a promotion, a VIP move, a few nervous minutes. ReplicatedMergeTree has no primary to promote, so I wanted to see how much of that pain is simply gone. Then I wanted to find out what hurts instead, so after the replica I went after Keeper, which both replicas need for every insert.
The cluster from part 1 was healthy and under load: one writer and one reader, both going through HAProxy. All times are WET, 31 October.
A replica dies
I killed ch-1 the rudest way Docker offers, so the server got no graceful shutdown and no chance to tell anybody it was leaving:
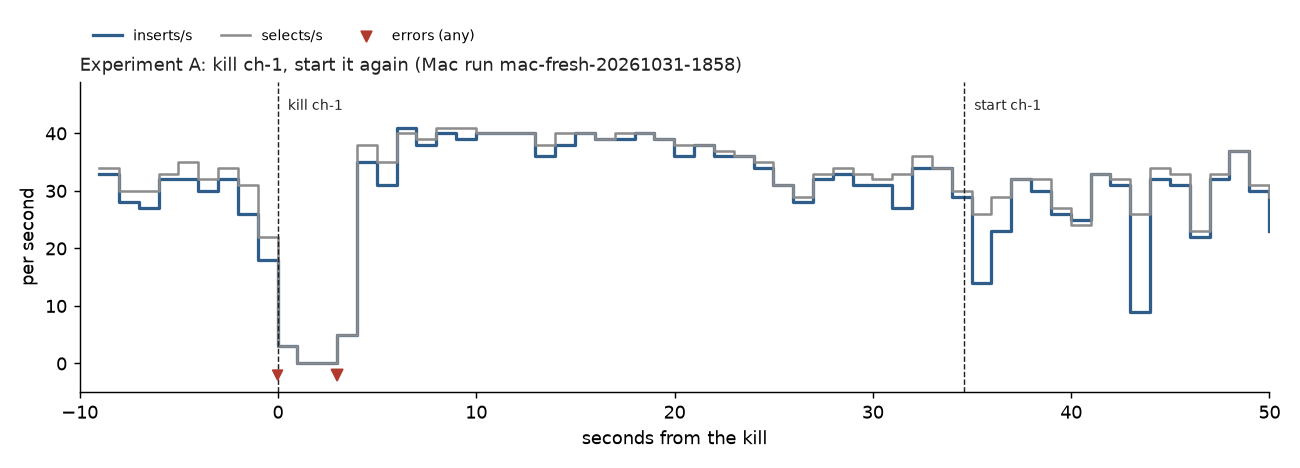
docker kill ch-1That was at 18:59:45.021. This is the load generator around it:
18:59:43 [ 30s ] inserts/s: 26 ins_err/s: 0 selects/s: 31 sel_err/s: 0
18:59:44 [ 31s ] inserts/s: 18 ins_err/s: 0 selects/s: 22 sel_err/s: 0
18:59:45 [ 32s ] inserts/s: 3 ins_err/s: 1 selects/s: 3 sel_err/s: 0
18:59:46 [ 33s ] inserts/s: 0 ins_err/s: 0 selects/s: 0 sel_err/s: 0
18:59:47 [ 34s ] inserts/s: 0 ins_err/s: 0 selects/s: 0 sel_err/s: 0
18:59:48 [ 35s ] inserts/s: 5 ins_err/s: 1 selects/s: 5 sel_err/s: 1
18:59:49 [ 36s ] inserts/s: 35 ins_err/s: 0 selects/s: 38 sel_err/s: 0
18:59:50 [ 37s ] inserts/s: 31 ins_err/s: 0 selects/s: 35 sel_err/s: 0
Two full seconds with nothing at all, a bit of traffic either side, then normal service on ch-2 from 18:59:49.
That’s it: over the whole window I counted two insert errors and one select error, and every one of them was a connection reset:
Code: 210. DB::NetException: Net Exception: Connection reset by peer (haproxy:9000, ...). (NETWORK_ERROR)Why a reset and not a timeout? The backend has on-marked-down shutdown-sessions, so as soon as HAProxy decides ch-1 is gone it cuts whatever connections were still pointed at it. A statement in flight on ch-1 gets an error straight away, and because the loader opens a new connection for every statement, the next one lands on ch-2.
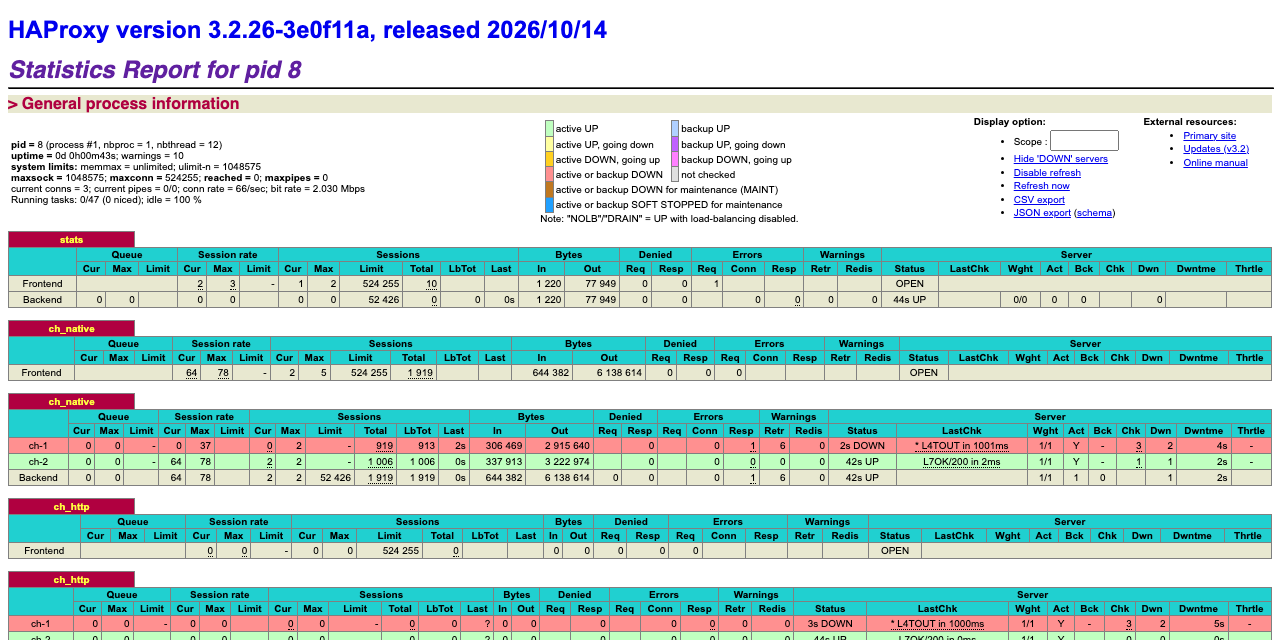
How fast did HAProxy notice? I sampled its CSV stats once a second right after the kill:
18:59:45 ch-1=UP ch-2=UP
18:59:46 ch-1=UP ch-2=UP
18:59:47 ch-1=UP 1/2 ch-2=UP
18:59:48 ch-1=UP 1/2 ch-2=UP
18:59:49 ch-1=DOWN ch-2=UP
...
UP 1/2 is HAProxy saying one check has failed and it wants a second one (fall 2). It marked ch-1 DOWN about four seconds after the kill, which is the moment the load generator went back to normal. That’s what one-second checks with two failures buy you. Production settings are often slower, so I’d expect your stall to be longer than mine.
The dead server that still looks alive
Here’s the part I’d really like you to remember. Nine seconds or so after the kill, I asked ch-2 how many replicas were active:
SELECT replica_name, is_readonly, active_replicas, total_replicas, queue_size
FROM system.replicas WHERE table='events'
┌─replica_name─┬─is_readonly─┬─active_replicas─┬─total_replicas─┬─queue_size─┐
1. │ ch-2 │ 0 │ 2 │ 2 │ 1 │
└──────────────┴─────────────┴─────────────────┴────────────────┴────────────┘Two of two, even though HAProxy had already taken ch-1 out. Keeper still had its session, which only expires after session_timeout_ms, 30 seconds in this lab. The same query 25 seconds later finally said active_replicas 1.
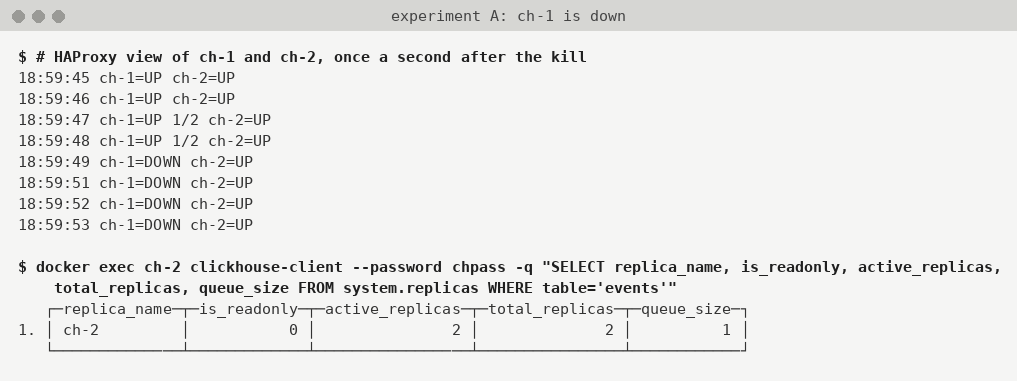
So if your monitoring alerts on active_replicas, it’s half a minute late here, and later still with the longer session timeouts people run in production. The proxy knew about 25 seconds earlier. That’s the signal I’d page on.
Bringing ch-1 back
After 34 seconds I started it again and waited until it answered SELECT 1:
docker start ch-1
until docker exec ch-1 clickhouse-client --password chpass -q "SELECT 1" >/dev/null 2>&1; do sleep 0.5; done
It answered 0.847 seconds after docker start, and because HAProxy needs two good checks (rise 2) before it trusts a server again, it had ch-1 UP about 2.4 seconds after the start. The load generator didn’t log a single error during the return. It did dip, to 14 inserts per second at 19:00:20 and 23 at 19:00:21, then it was back above 30.
What did ch-1 do in those first seconds? I flushed the logs and looked at system.part_log for the first 12 seconds after the start:
   ┌─event_type──────┬─count()─┬─────min(event_time)─┬─────max(event_time)─┬─sum(rows)─┐
1. │ NewPart         │     147 │ 2026-10-31 19:00:22 │ 2026-10-31 19:00:30 │    147000 │
2. │ MergeParts      │      82 │ 2026-10-31 19:00:21 │ 2026-10-31 19:00:30 │   7144000 │
3. │ DownloadPart    │     136 │ 2026-10-31 19:00:20 │ 2026-10-31 19:00:30 │   1311000 │
4. │ RemovePart      │     454 │ 2026-10-31 19:00:20 │ 2026-10-31 19:00:20 │   6973483 │
5. │ MergePartsStart │      82 │ 2026-10-31 19:00:21 │ 2026-10-31 19:00:30 │         0 │
   └─────────────────┴─────────┴─────────────────────┴─────────────────────┴───────────┘
DownloadPart is ch-1 fetching what ch-2 wrote while it was gone: 136 parts, 1,311,000 rows, starting the second it came up. NewPart is fresh inserts from the load generator, from 19:00:22, the second HAProxy put it back. Nobody told it to resync. It read the list of parts from Keeper and fetched what it was missing.
A dead replica turned out to be the easy case, and Keeper is a different story.
The Keeper leader goes
Before the next kill, mntr said keeper-1 was the leader. The replicas had their Keeper sessions elsewhere, ch-1 on keeper-3 and ch-2 on keeper-2. At 19:00:41.103 I ran docker kill keeper-1 and polled mntr once a second:
19:00:42 keeper-1=down keeper-2=follower keeper-3=down
19:00:43 keeper-1=down keeper-2=leader keeper-3=follower
19:00:44 keeper-1=down keeper-2=leader keeper-3=follower
keeper-3 probably missed one check because it was busy with the election, and keeper-2 was leader within roughly two seconds. And the application?
19:00:40 [ 87s ] inserts/s: 35 ins_err/s: 0 selects/s: 35 sel_err/s: 0
19:00:41 [ 88s ] inserts/s: 4 ins_err/s: 0 selects/s: 34 sel_err/s: 0
19:00:42 [ 89s ] inserts/s: 0 ins_err/s: 0 selects/s: 38 sel_err/s: 0
19:00:43 [ 90s ] inserts/s: 0 ins_err/s: 0 selects/s: 39 sel_err/s: 0
19:00:44 [ 91s ] inserts/s: 9 ins_err/s: 0 selects/s: 37 sel_err/s: 0
19:00:45 [ 92s ] inserts/s: 33 ins_err/s: 0 selects/s: 33 sel_err/s: 0
Inserts stopped for two seconds and came back on their own, without a single error. Selects didn’t even notice, which makes sense, because a SELECT on a replicated table reads local parts and doesn’t go near Keeper.
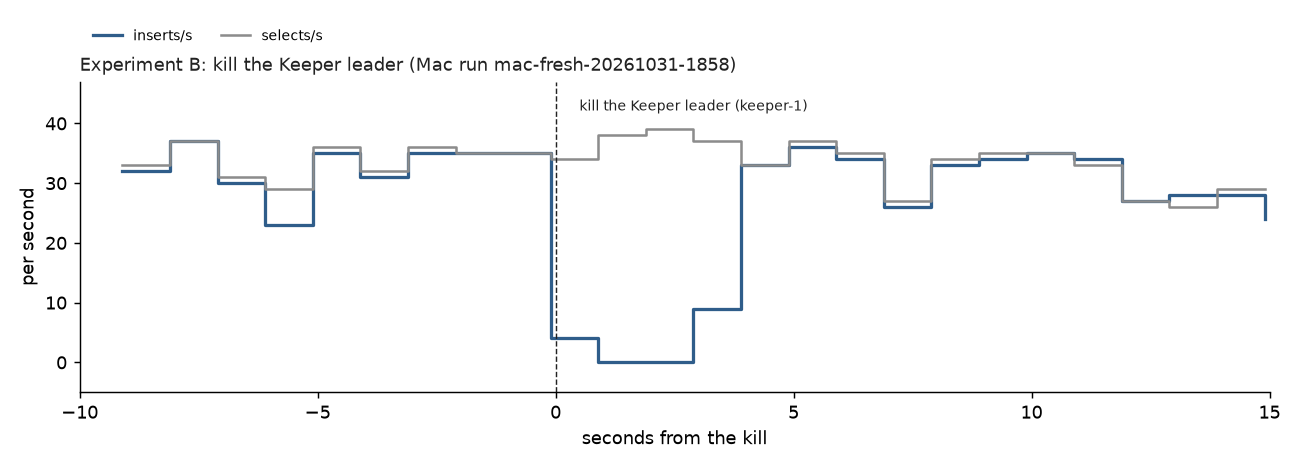
I have to be honest about the spread, though. The same kill in my two earlier Mac runs stalled inserts for 1 second and for 12. In all three runs both replica sessions sat on Keepers that survived. My first guess was the 10-second operation_timeout_ms, which would explain 12 seconds but not 1 or 2, so I’d call it unconfirmed. I’d plan for the 12 seconds and treat anything shorter as a nice surprise.
Then the quorum
With keeper-1 still dead, I killed the new leader, keeper-2, at 19:00:57.395. That leaves keeper-3 on its own. One node out of three isn’t a majority, so it can’t commit anything, and a replica that can’t write to Keeper can’t register a new part.
I expected a burst of errors, but what I got was silence:
19:00:57 [ 104s ] inserts/s: 13 ins_err/s: 0 selects/s: 30 sel_err/s: 0
19:00:58 [ 105s ] inserts/s: 0 ins_err/s: 0 selects/s: 39 sel_err/s: 0
19:00:59 [ 106s ] inserts/s: 0 ins_err/s: 0 selects/s: 38 sel_err/s: 0
...
19:03:19 [ 246s ] inserts/s: 0 ins_err/s: 0 selects/s: 36 sel_err/s: 0
19:03:20 [ 247s ] inserts/s: 0 ins_err/s: 1 selects/s: 40 sel_err/s: 0
19:03:21 [ 248s ] inserts/s: 0 ins_err/s: 0 selects/s: 39 sel_err/s: 0
Remember how to read 0 ... 0 from part 1? The writer sends one insert at a time. For 143 seconds that one insert just sat there, with the client holding an open connection and no idea whether anything would ever come back. Then it failed:
Code: 242. DB::Exception: Received from haproxy:9000. DB::Exception: Table is in readonly mode: replica_path=/clickhouse/tables/01/lab/events/replicas/ch-2. (TABLE_IS_READ_ONLY)
(query: INSERT INTO lab.events SELECT now64(3), 2995, number, rand() % 10000, rand() / 1e6 FROM numbers(1000))
The next batch, 2996, landed on ch-1, hung for another 143 seconds and failed the same way at 19:05:43. Meanwhile selects ran at 30 to 42 a second, with zero errors.
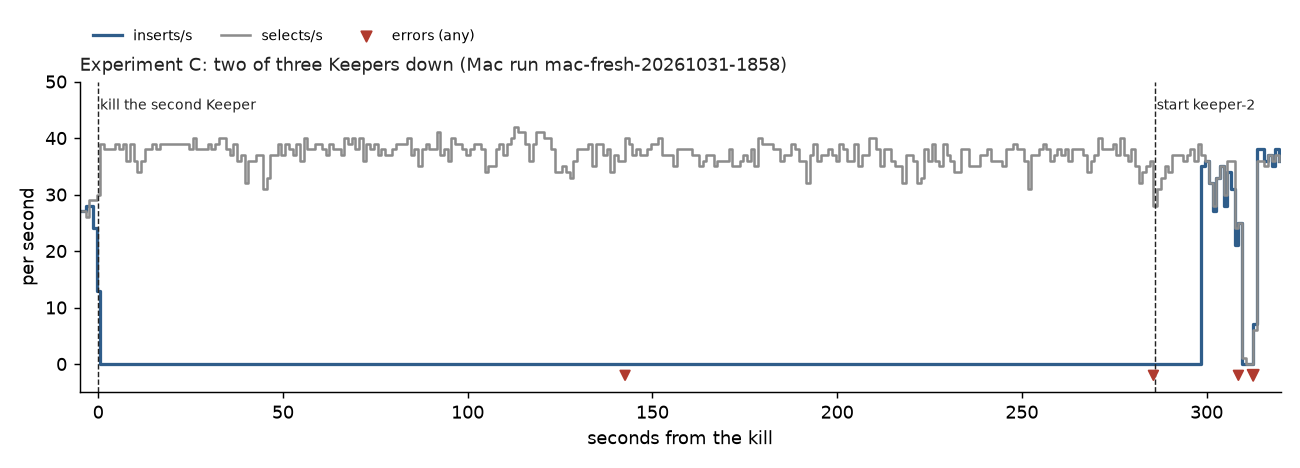
Why so long? I’m fairly sure it’s the insert retrying its Keeper operations inside the server, governed by insert_keeper_max_retries. You can check that by turning the retries off for one insert:
INSERT INTO lab.events SETTINGS insert_keeper_max_retries = 0 SELECT now64(3), 0, 1, 1, 1That one failed in 0.072 seconds with the same TABLE_IS_READ_ONLY. So the 143 seconds aren’t Keeper being slow; they’re the server being patient on your behalf.
The health check that can’t see it
This worried me most.
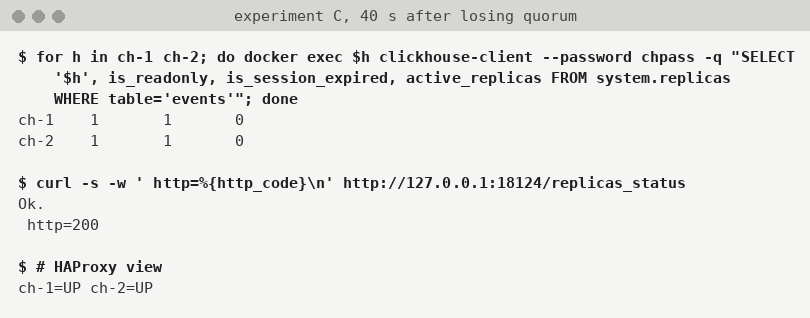
Forty seconds after the second kill I looked at both replicas, the HTTP check HAProxy uses, and HAProxy itself:
ch-1	1	1	0
ch-2	1	1	0
Ok.
 http=200
ch-1=UP ch-2=UP
After the replica name, the first two lines show is_readonly, is_session_expired, then active_replicas. Both tables were read-only with expired sessions. Yet /replicas_status answered Ok. with HTTP 200, and HAProxy kept both servers UP.
The stats page looked just as calm:
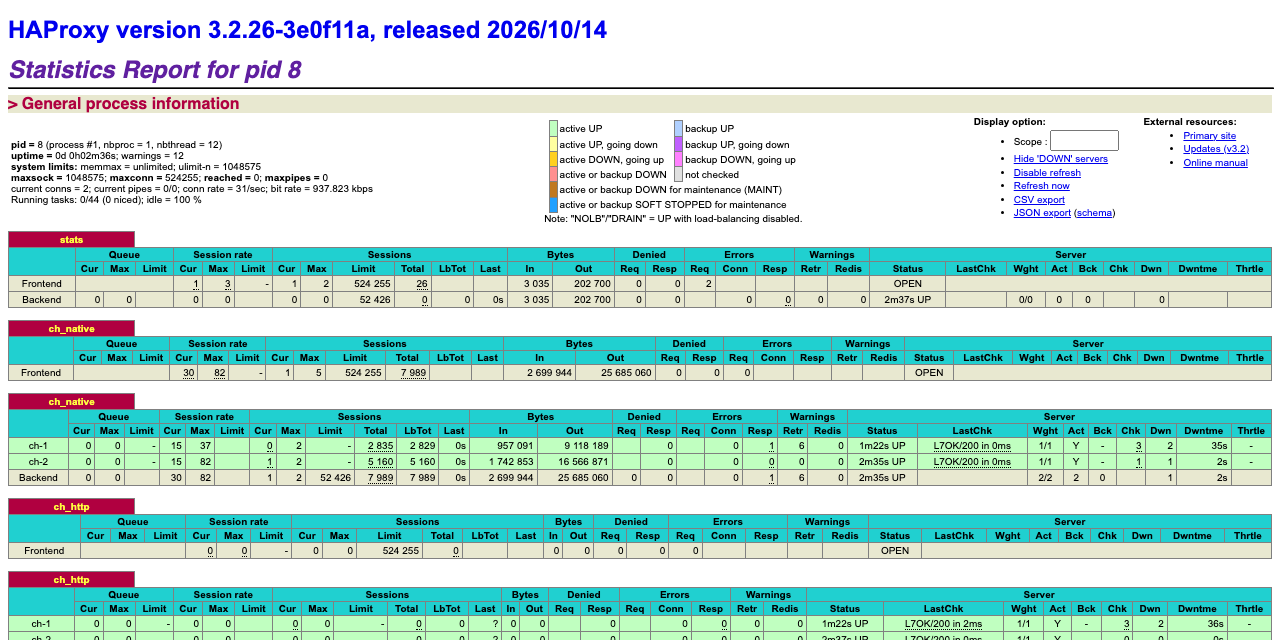
It’s probably not a bug in the check. /replicas_status reports whether replicas are lagging, and a read-only replica isn’t lagging. But it means the proxy gives you no signal during the worst failure in this post. You need a separate alert on is_readonly in system.replicas.
At 19:05:43.399 I started keeper-2 again. ch-2 was writable 4.6 seconds later and ch-1 after 10.6. The first successful inserts showed up at 19:05:56, and the loader went straight back to 35 a second. I didn’t touch the replicas.
Was that a lucky run?
I ran the same sequence three times on this Mac, measured the same way each time:
Scroll horizontally to see all columns when needed.
| 31 Oct 18:59 | 30 Oct 00:06 | 31 Oct 00:03 | |
|---|---|---|---|
| Replica kill: seconds with no insert | 2 | 0 | 3 |
| Replica kill: insert / select errors | 2 / 1 | 2 / 1 | 1 / 2 |
| HAProxy marked ch-1 DOWN after | 4.0 s | 2.5 s | 3.9 s |
HAProxy had ch-1 UP after docker start | 2.4 s | 2.5 s | 1.4 s |
| Errors when ch-1 came back | 0 | 0 | 0 |
| Leader kill: seconds with no insert | 2 | 1 | 12 |
| Leader kill: new leader seen after | 1.9 s | 1.1 s | 2.1 s |
| Quorum loss: first insert error after | 143 s | 143 s | 142 s |
| Quorum loss: select errors | 0 | 0 | 0 |
Insert with insert_keeper_max_retries = 0 | 0.072 s | 0.059 s | 0.055 s |
| Writable after Keeper start (ch-1 / ch-2) | 10.6 / 4.6 s | 4.7 / 0.7 s | 1.7 / 9.7 s |
The replica kill moved by about a second, which is the health-check interval. The 142 to 143 seconds didn’t move at all, because they’re set by the retry settings rather than the load. The leader-kill stall is the one number I can’t pin down.
Verdict
Losing a replica behind HAProxy cost my application about three seconds and a handful of retryable connection resets, with nothing to promote and nothing to resync by hand.
Losing the Keeper leader is a blip, but losing the majority is the real outage, and your proxy won’t see it: selects keep working, the health check stays green, and every insert hangs for well over two minutes before it fails.
So retry statements on a connection reset, put the three Keepers on separate hosts, and alert on is_readonly rather than on active_replicas. Then decide on purpose whether an insert should fail fast (insert_keeper_max_retries = 0) or wait, because the default chooses waiting.
Next, part 3 asks a stricter question: when ClickHouse says “inserted”, is it really there?