
MySQL async replication HA, part 1 – a source, two replicas, ProxySQL and Orchestrator
Published By Krzysztof Książek Lab
Lab write-up. A hands-on environment built and run by the author, not a customer engagement.
Environment described in the article: MySQL 8.4.11, ProxySQL 2.7.3, Percona Orchestrator 3.2.6, Docker Engine 29.1.3 / Compose 2.40.3.
Series: 1 the build · 2 the source dies · 3 replicas die, and the reads you sent them
A lot of people I talk to have run MySQL replication for years and never watched a failover happen. They know the theory. They’ve never seen what the application gets back in the two seconds when the source is gone and nobody has picked a new one yet. So I built the smallest setup that has all the moving parts, and then I killed things on purpose.
Highly available, in this series, means one thing.
The application keeps a single address, and its writes resume after the server that was taking them dies. This first part is only the build and the healthy state. The killing starts in part 2.
What I built
One MySQL server takes the writes (the source), two copy its data (the replicas), a proxy sits in front, and a failover tool picks a new source when the old one disappears:
your app (sysbench)
        |
        v
    ProxySQL          the only address the app knows
        |
        +-- mysql-1   source, takes the writes
        +-- mysql-2   replica
        +-- mysql-3   replica

Orchestrator watches all three.
When mysql-1 dies, Orchestrator promotes mysql-2
and tells ProxySQL to send writes there.
Everything runs in Docker Compose, from the lab folder 20261019-mysql-async-replication-ha. Every number and screenshot in this series is from real runs on 19 October 2026, and nothing is mocked. I should be upfront about one thing, though. The logs and sysbench lines are from the first run. I retook the screenshots in a second run later that day, so the server UUIDs and clock times in the images won’t match the logs (nor will GTID ranges and counters). The source-failure experiment in part 2 comes from a third run that evening, after I’d fixed a bug in the failover hook, and its logs and screenshots do match.
You don’t need much. I’d give Docker about 4 GB free: each MySQL has a 128 MB buffer pool, but the whole set still wants a few gigabytes once caches and images are counted. Two cores are enough; my host had four. You’ll want curl and python3. The first run pulls images, and after that a clean deploy took about a minute.
These are the ports on your machine. They sit above the other labs in the repository, so two labs can run side by side:
Scroll horizontally to see all columns when needed.
| What | Address | Login |
|---|---|---|
| Application MySQL (ProxySQL) | 127.0.0.1:16033 | sbuser / sbpass |
| ProxySQL admin | 127.0.0.1:16032 | radmin / radmin |
| ProxySQL web page | https://127.0.0.1:16080/ | stats / stats |
| Orchestrator web page | http://127.0.0.1:13000/ | no login |
| mysql-1, mysql-2, mysql-3 | 127.0.0.1:13316, :13317, :13318 | root / mysql |
Open the ProxySQL page with https, because plain http:// on port 6080 returns an empty reply. The built-in admin / admin user also exists, but ProxySQL only accepts it from inside the container; from your machine it fails with ERROR 1040 ... can only connect locally. That detail comes back in part 2.
It bit me. The passwords are plain text and there’s no TLS. That’s deliberate, so you can read every command, but please don’t copy these files onto a real server.
How the pieces fit
Replication here is asynchronous. The source writes the change to its own disk, tells the client “committed”, and only then do the replicas pull the change and apply it. They’re usually a fraction of a second behind. That gap is the tradeoff: if the source dies inside it, a transaction the client was told had committed can be missing on the new source.
Each change goes into the source’s binary log with a GTID, the source’s id plus a counter (server-uuid:1-16 and so on). A replica remembers which GTIDs it has applied and asks for the rest, so nobody has to tell it which binlog file to start at. The lab turns this on with gtid_mode=ON and attaches replicas with SOURCE_AUTO_POSITION=1. MySQL 8.4 removed the old MASTER and SLAVE commands, so you’ll type CHANGE REPLICATION SOURCE TO and SHOW REPLICA STATUS. Orchestrator’s web page still says “master”. I’ll call it the source.
The replicas run with read_only=ON and super_read_only=ON, so even root can’t write to them by mistake. Orchestrator turns both off in memory when it promotes a replica. The config file on disk still says ON, which is a footgun I’ll come back to.
The application connects to ProxySQL, not to mysql-1. ProxySQL keeps lists of servers called hostgroups, and in this lab hostgroup 10 is the writer and 20 is the readers. There’s also 30, a quarantine. A monitor thread asks every server for read_only and puts a server that answers 0 in hostgroup 10 and one that answers 1 in hostgroup 20. It also pings once a second, and after two failed pings (shun_on_failures=2) it marks the server SHUNNED and stops sending it queries.
Orchestrator logs into every server and notices when the source stops answering. With the lab’s settings that takes about two seconds (InstancePollSeconds=2, connect timeout 1 second). It then picks a replica, preferring mysql-2 and refusing any host other than mysql-2 or mysql-3. It makes that replica writable, points the surviving replica at it using GTIDs, and runs the hook proxysql-failover-hook.sh. Why a hook?
Orchestrator 3.2.6 has no built-in way to edit ProxySQL hostgroups, and PostMasterFailoverProcesses is the supported way to extend it. The hook logs in to the admin port as radmin, parks the dead source in hostgroup 30, and inserts the new source into hostgroup 10. I used Percona’s build of Orchestrator, because the older upstream build still sends the commands MySQL 8.4 removed and can’t discover these servers.
How to read a sysbench line
sysbench plays the application. oltp_read_write mixes reads and writes inside a transaction, and the lab runs it with 4 threads against 4 tables of 10 000 rows, printing one line per second. This is a healthy line from my host:
01:15:39 [ 582s ] thds: 4 tps: 871.04 qps: 17399.82 (r/w/o: 12178.57/3479.16/1742.08) lat (ms,95%): 6.91 err/s: 0.00 reconn/s: 0.00The lab prefixes the clock time so you can line it up with a kill, and [ 582s ] is how long sysbench has been running. tps counts transactions, one BEGIN … COMMIT each, and qps counts every statement, including those two. r/w/o splits the queries into reads, writes and “other”, which is mostly BEGIN and COMMIT. lat (ms,95%) is the 95th-percentile transaction time.
The two columns I watch during a failure are err/s, errors per second, and reconn/s, new connections per second; a jump in the second means threads lost their connection and came back. The lab runs sysbench with --mysql-ignore-errors=all. Without it, sysbench exits at the first error, and you’d never see the recovery line.
A healthy run on my host sat around 770–900 tps, err/s 0, with a 95th percentile of about 7 ms. Your laptop will land somewhere else, so compare a failure with the lines just before it, not with my numbers.
Building it
From the lab folder:
git clone https://github.com/ghkrzysztof-ksiazek/database-labs.git
cd database-labs/20261019-mysql-async-replication-ha
./scripts/lab.sh deploy
./scripts/lab.sh verify
verify prints verify: steady state ok when both replicas are applying with super_read_only=1 and ProxySQL’s only online writer is mysql-1. It also wants Orchestrator to know 3 servers and the sysbench container to be running. After a failover it fails on purpose, because the writer isn’t mysql-1 any more.
If you’d rather type every grant and admin statement yourself, docs/manual-setup.md is the same procedure with the output you should see after each stage. A clean run of it on an empty volume gave me the same steady state, with one shared GTID set (…:1-16) and 3 instances in Orchestrator.
Two details tripped me up while building it.
The replicas are a file copy of the source’s data directory with auto.cnf removed. Copying the files keeps the GTID history identical, which is what makes a later promotion safe; three empty containers would have three unrelated histories, and Orchestrator would refuse to promote. And the wait for MySQL looks for the log line MySQL init process done. Ready for start up. before it runs SELECT 1. A ping against the official image succeeds too early, against a temporary server that’s about to exit, and the next command then fails with ERROR 2002.
What healthy looks like
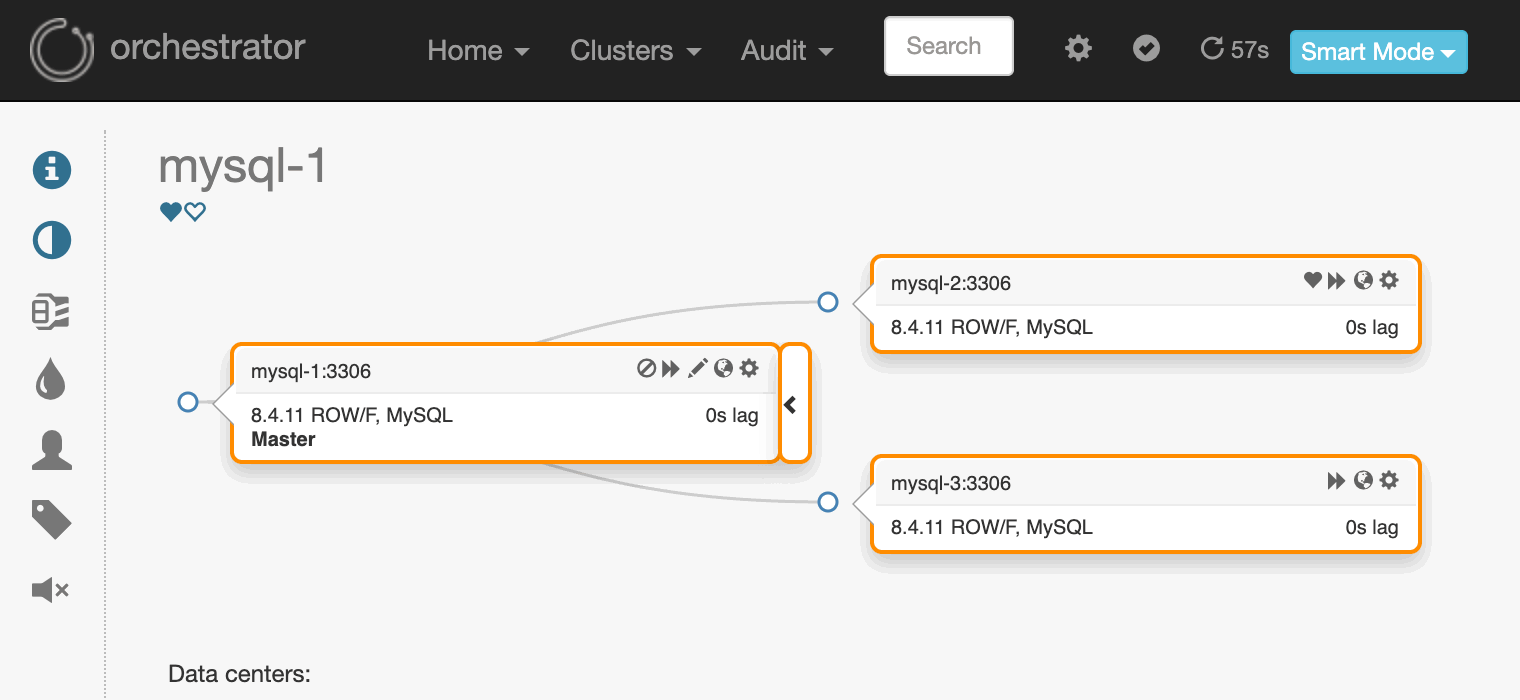
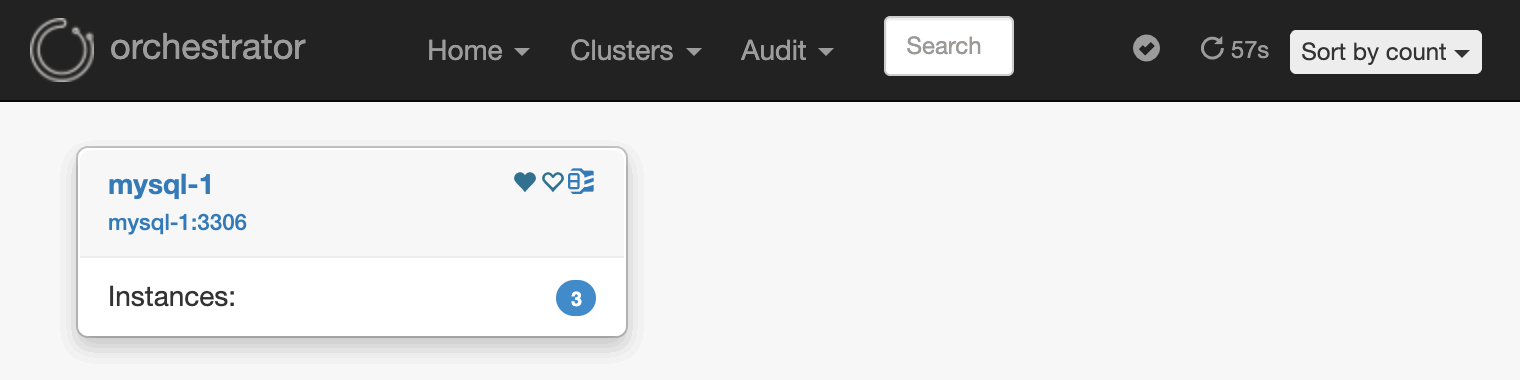
In Orchestrator, at http://127.0.0.1:13000/, the cluster named mysql-1 has mysql-1 on top, read/write, with the two replicas under it:
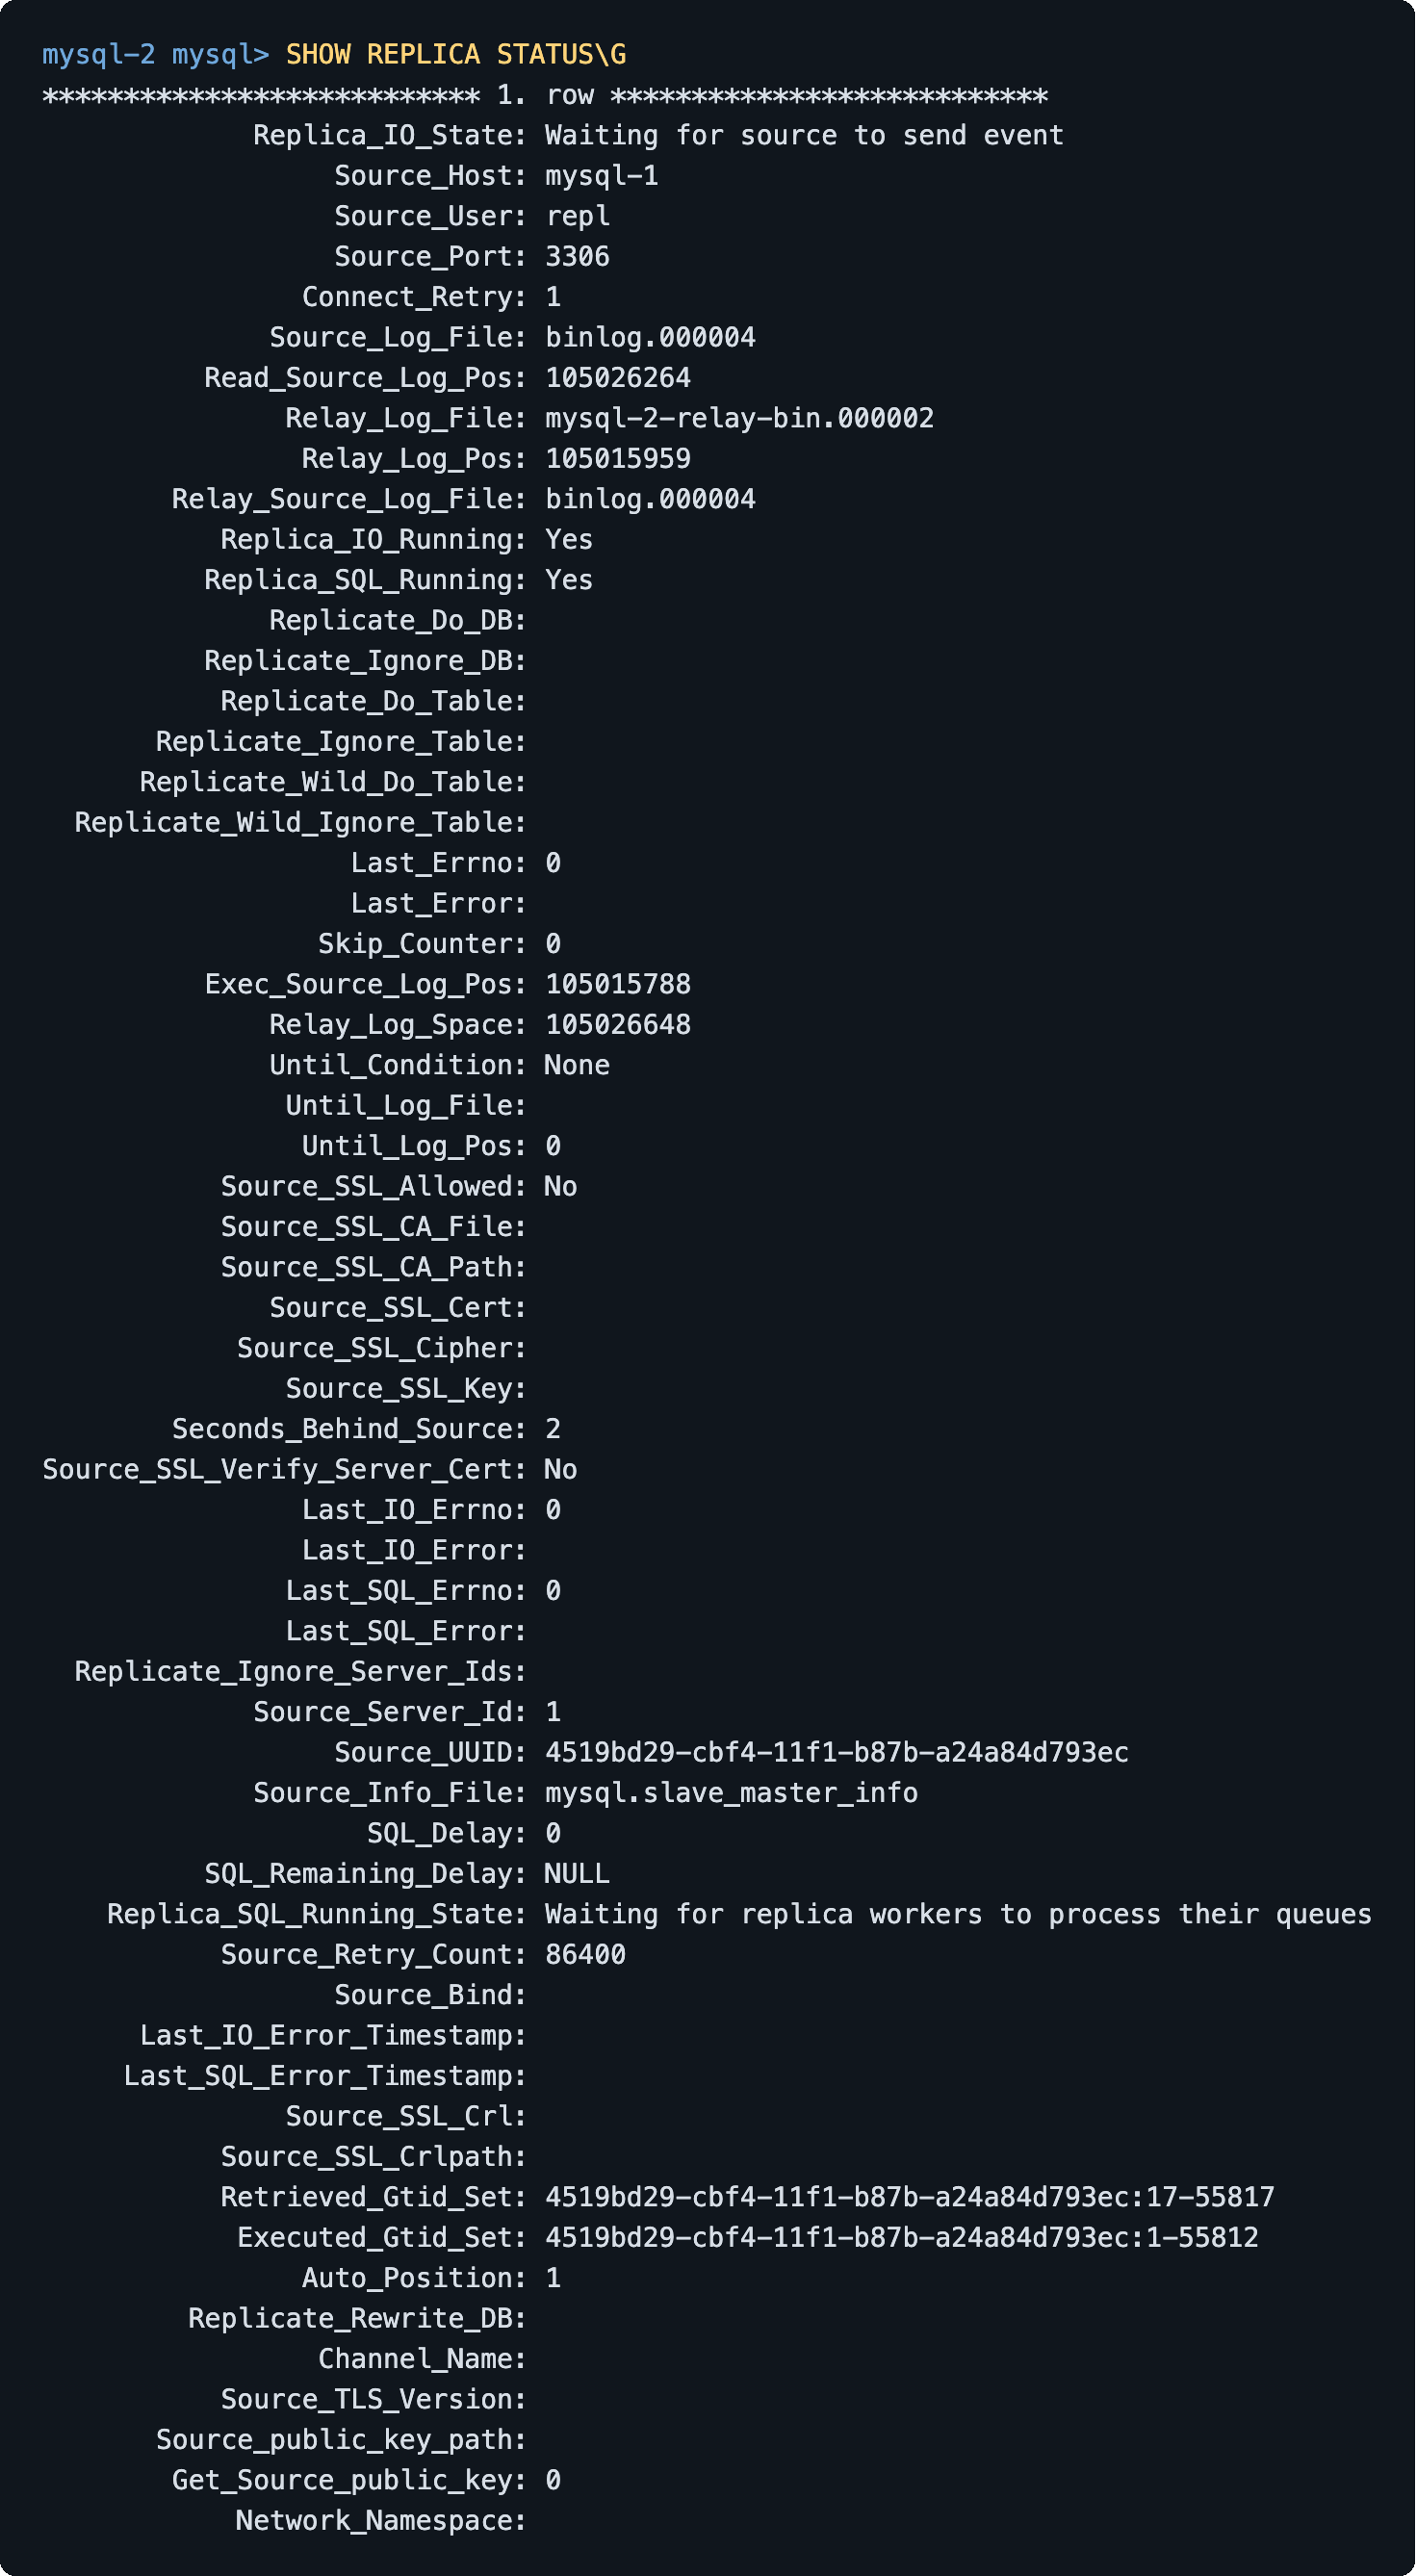
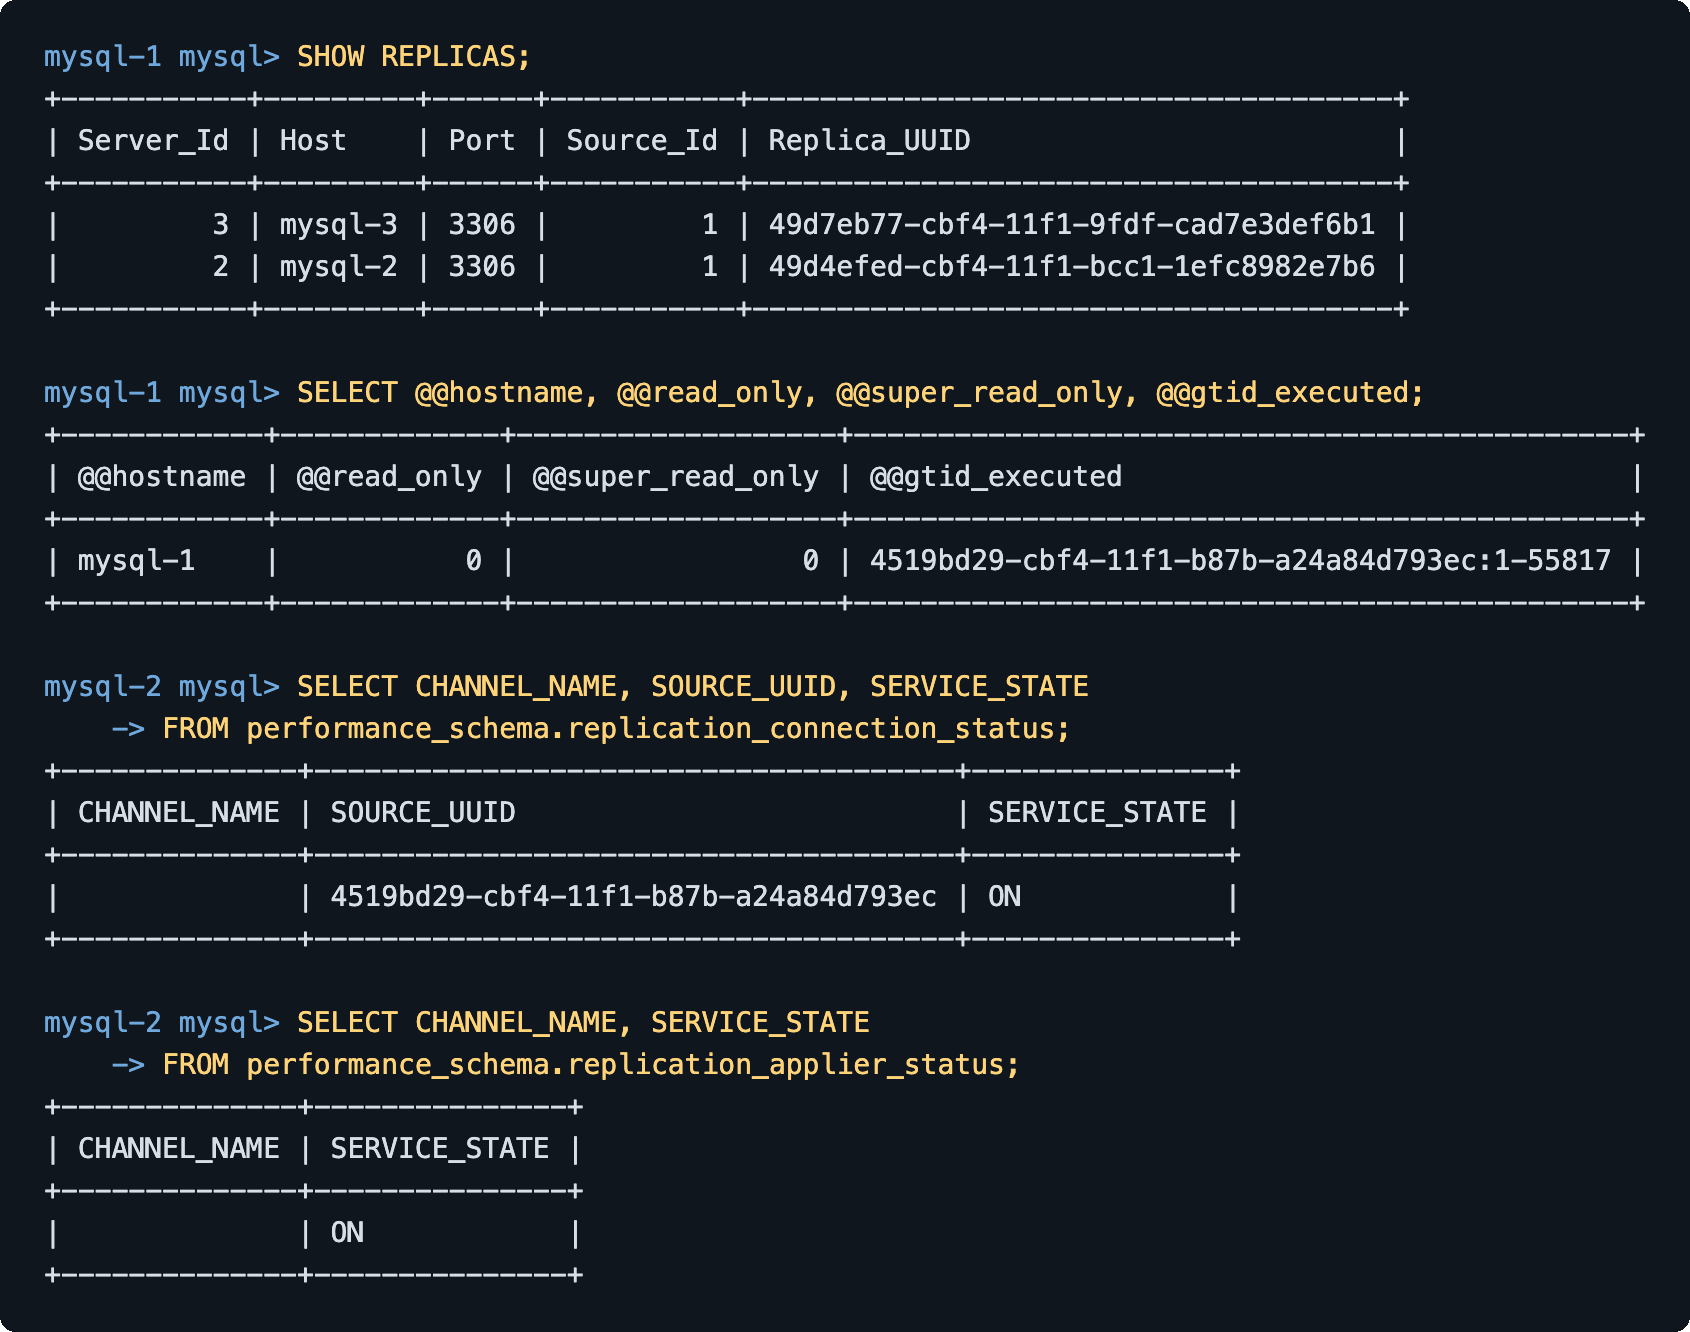
On mysql-2, SHOW REPLICA STATUS shows Source_Host mysql-1, both thread columns Yes, and Auto_Position 1, which is the GTID attach. On the source, SHOW REPLICAS lists both replicas.
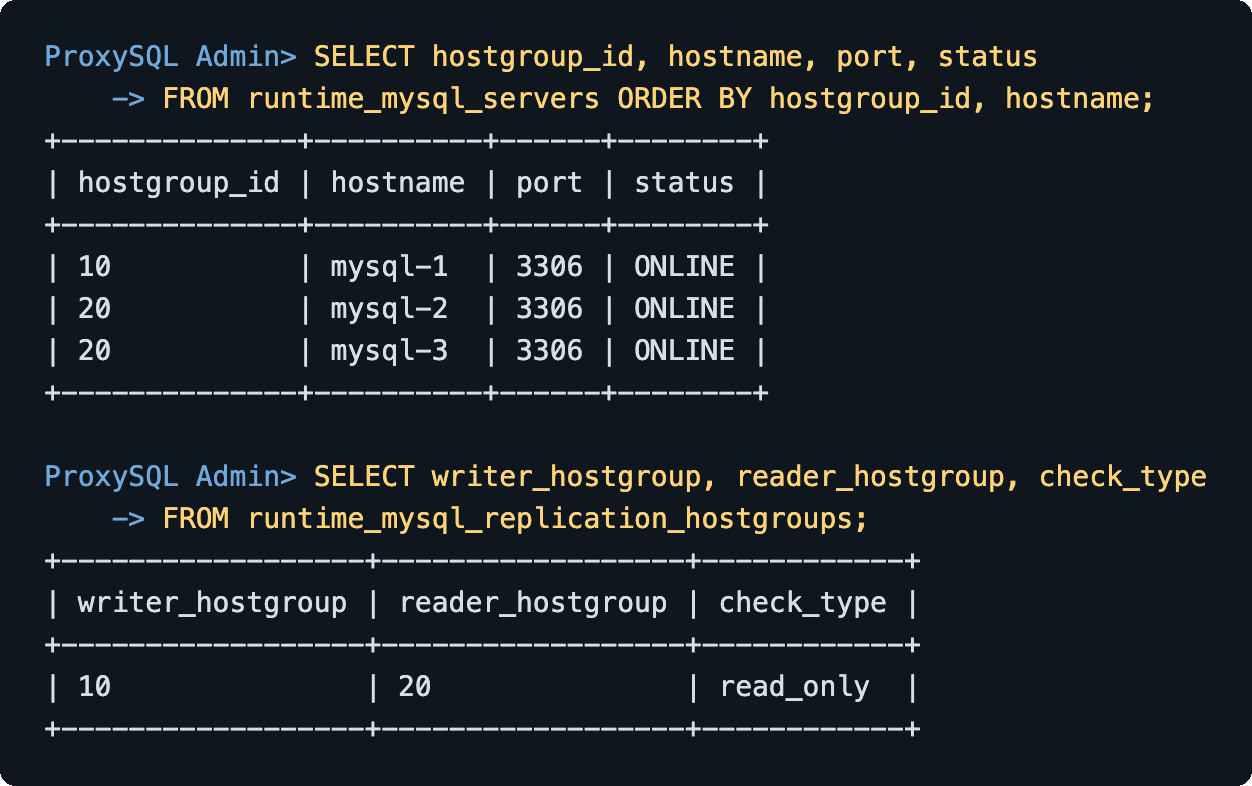
The table I’d check first, though, is ProxySQL’s runtime, because it’s the one the application actually uses. Hostgroup 10 has mysql-1 ONLINE, and hostgroup 20 has mysql-2 and mysql-3, both ONLINE:
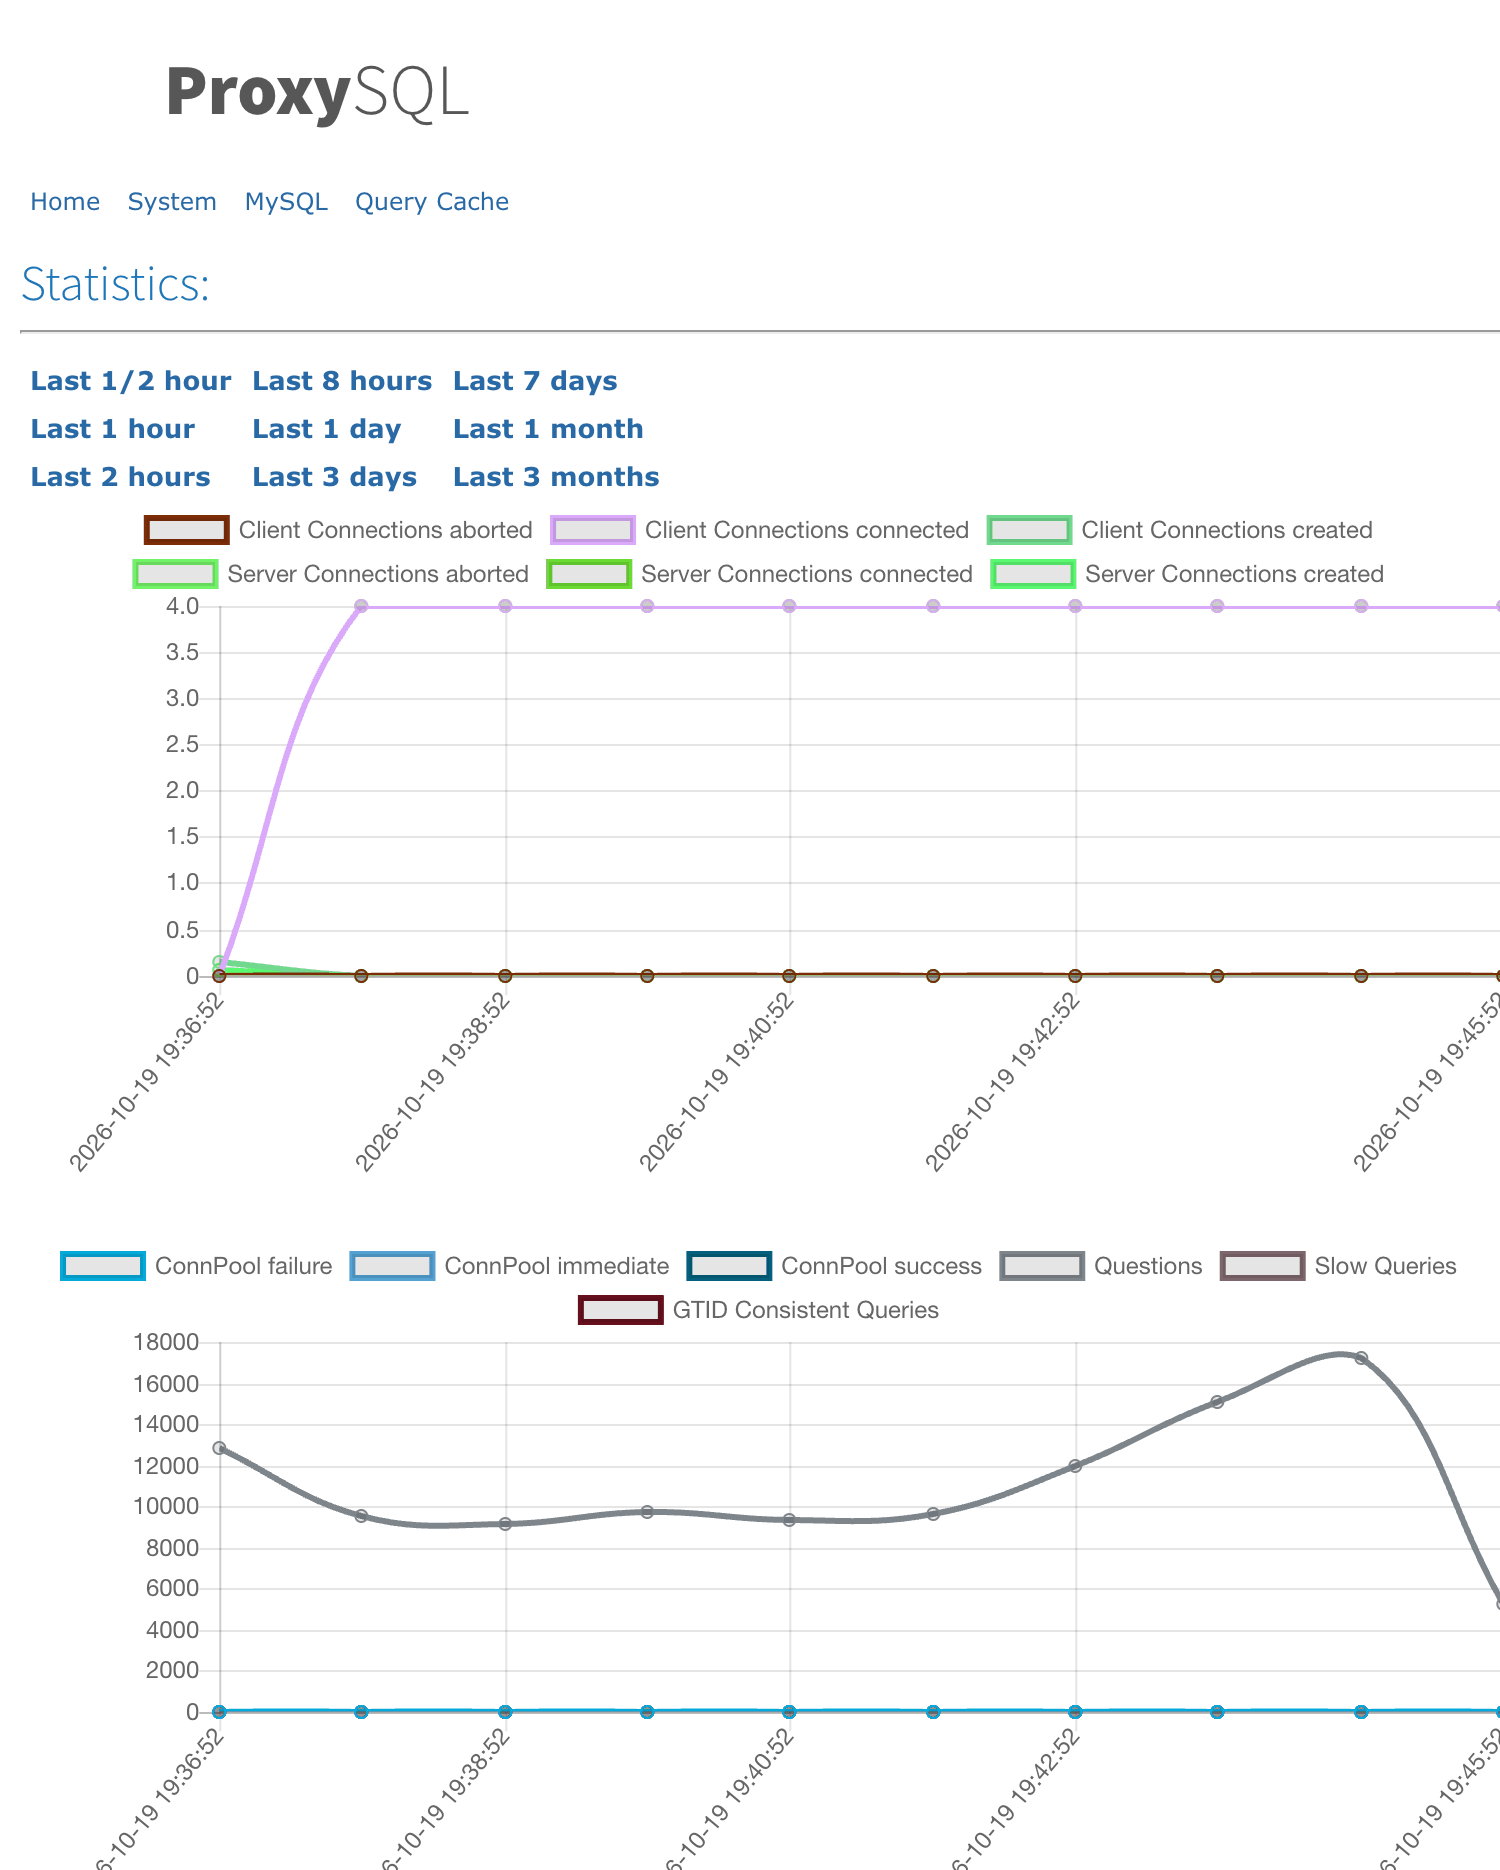
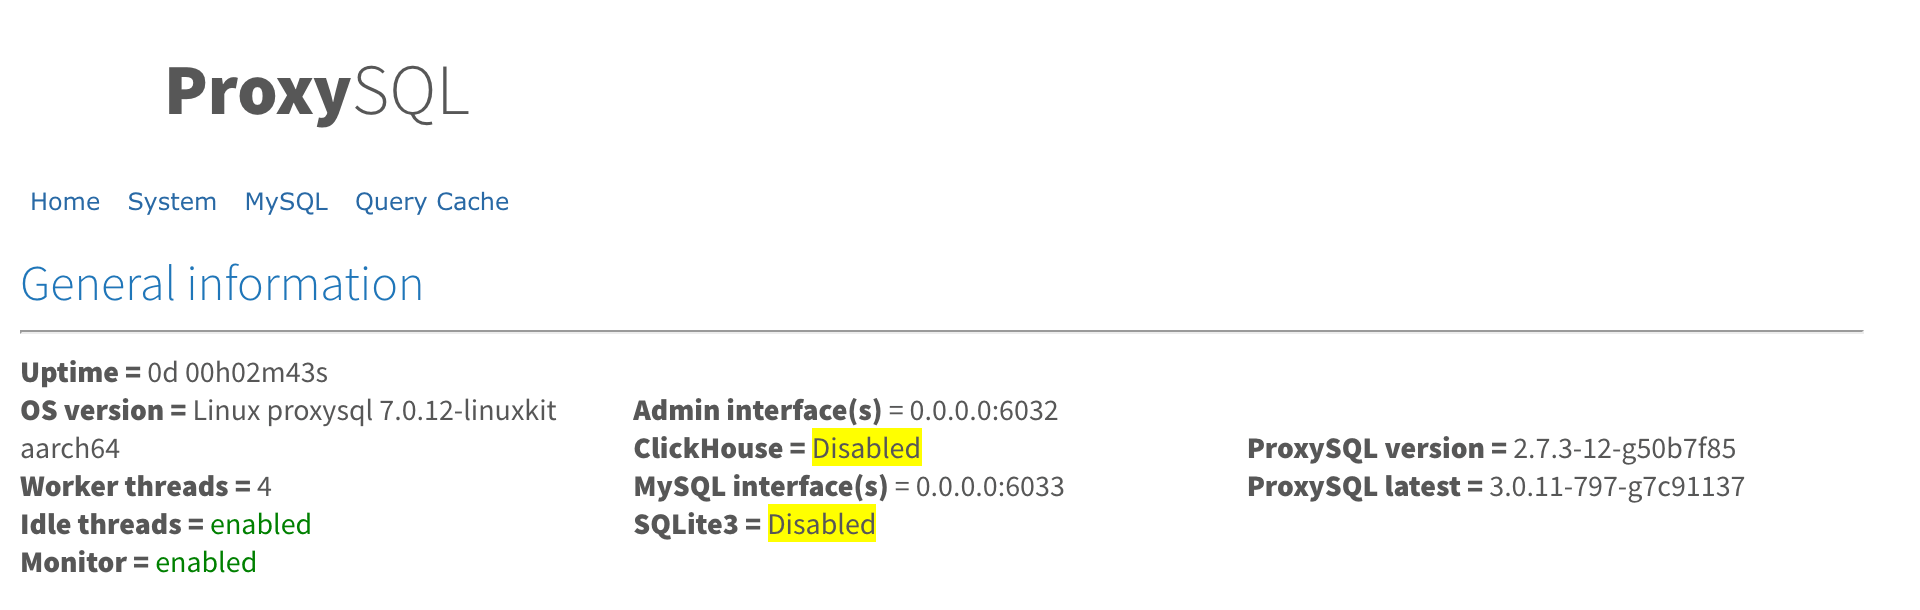
The ProxySQL web page only draws connection graphs; it doesn’t show hostgroups or rule hits, which is why my other screenshots are SQL on the admin port. With sysbench running you should see a handful of client connections and about four server connections:
And docker logs -f sysbench looks like the sample above: hundreds of transactions per second, err/s 0, reconn/s 0.
Verdict
This is a small cluster, but every piece of a real one is in it: a writable source, read-only replicas with a shared GTID history, a proxy that sorts servers by read_only, and a failover tool that tells the proxy what it did. I’d treat the healthy screenshots and sysbench line above as the baseline. Every failure in the next two parts is measured against them.
In part 2 I kill the source and watch the application, second by second.